An optional temperature sensor can be installed to complement or replace the existing temperature indicator in your vehicle. Many new cars use high and low temperature lamps instead of traditional sensors. Although the lights warn you of dangerous temperatures, they do not provide information about the vehicle's operating temperature. Adding a temperature sensor will allow you to monitor the temperature of your engine under various conditions and provide early warning of potential problems.
Studying the dynamic characteristics of the vehicle coolant temperature sensor
Laboratory work No. 2 on CTS
Laboratory plan:
1. Study of the device and principle of operation of the sensor. 2. Scheme for connecting the sensor to the electrical circuit - transistor current source. 3. Study of the operating principle of the measuring complex based on the ZET 210 ADC and user interface. 4. Connecting the sensor to the measuring complex. 5. Obtaining the dynamic characteristics of the sensor when heated from ~20°C to 100°C. 6. Processing of experimental results. Determination of the sensor transfer function. Determination of the transfer coefficient and time constant of the sensor. 7. Simulation of the transient process when the sensor is heated in MATLAB Simulink. Refinement of transfer function parameters. 8. Preparation of a report on laboratory work. The report must contain: — diagram of connecting the sensor to the ADC; — experimentally obtained graph of the transient process when the sensor is heated; — transfer function of the sensor and superimposed graphs of the transient process obtained from modeling and experiment.
Design and principle of operation of a car coolant temperature sensor
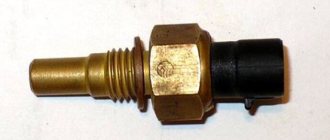
Sensors 23.3828 and 27.3828 engine coolant temperature (DTOZH) (Fig. 1 and 2) are designed to measure the coolant temperature in the outlet pipe of the water jacket of the engine cylinder head as part of the engine control system together with the engine electronic control system (ECM) unit. The sensors are used on VAZ vehicles (Fig. 3) equipped with an ECM.
Figure 1 — Appearance of temperature sensors 23.3828
Figure 2 — Appearance of temperature sensors 7.3828
Figure 3 - Installation of sensor 27.3828 on a VAZ-1118 engine
The main technical characteristics of the sensors are given in tables 1 and 2. Table 1
| Characteristic | Meaning |
| Operating voltage, V | 3,4±0,03 |
| Resistance, Ohm: | |
| at 15 °C | 4033…4838 |
| at 128 °C | 76,7…85,1 |
| Thread | M12×1.5 |
| Key size | S19 |
| Weight, g | 30 |
table 2
| Characteristic | Meaning |
| Rated voltage, V | 12 |
| Range of measured temperatures, °C | +(40…130) |
| Weight, g | 50 |
The operation of these sensors is based on the property of conductors and semiconductors to change their resistance when temperature changes. The thermistor located inside the sensor has a negative temperature coefficient of resistance, i.e. When heated, its resistance decreases. When the coolant temperature is high, the thermistor has low resistance, and when the coolant temperature is low, it has high resistance.
2. Sensor connection diagram
When connecting sensors of this type to a measurement system, it is necessary to ensure that a current flows through them with a constant value in the range of 1.0...1.5 A. In this case, when the temperature changes, the voltage drop across the sensor will be directly proportional to its resistance. In this lab, a transistor current source is used to power the sensors (Figures 4 and 5). Using a variable resistor R1 and an ammeter connected in series with the temperature sensor R5, you can set the required current value through the sensor at different supply voltages. A 12 V supply voltage is supplied to the current source through a four-pin connector (white), and a sensor is connected through a two-terminal connector (green). At the same terminals, the voltage drop across the sensor is measured, which can be converted into temperature. In a vehicle, similar sensor power is provided by the ECM.
Figure 4 - Transistor current source: circuit diagram
Figure 5 - Transistor current source: implementation
3. Measuring complex based on analog-to-digital converter ZET 210
The measuring complex used in this laboratory work consists of:
1. ZET 210 analog-to-digital converter (ADC) module, to which the sensor under study is connected (Fig. 6); 2. A laptop connected to the ADC via a USB 2.0 interface; ZETLAB software
, which provides configuration of the ADC, primary processing of signals, their display and recording to a hard disk.
The ZET 210 ADC module is designed for measuring signal parameters in a wide frequency range (with a sampling frequency of up to 500 kHz) coming from various primary converters. The module also has digital and analog outputs that can be used in control circuits of various actuators.
1 — terminals for connecting input analog signals; 2 — USB 2.0 connector for connecting to a computer; 3 — LED power indicator Figure 6 — Appearance of the ZET 210 ADC module
The main technical characteristics of the ZET 210 ADC module are presented on the page ZET 210 - a measurement laboratory in the palm of your hand!.
The ZET 210 ADC module works in conjunction with programs from the ZETLAB
, launched on a laptop connected to the module via USB 2.0 interface.
Management and launch of ZETLAB programs is carried out using the ZETLAB
(hereinafter referred to as the
ZETLAB
).
To launch it, use the ZETPanel shortcut on the desktop or the main menu Start → ZETLab → ZETPanel. ZETLAB
panel is a horizontal panel located at the top of the screen after launch (Figure 7).
Figure 7 — ZETLAB program control panel
In this work, the ZET 210 ADC module is configured using the ZETLAB
Service →
Device Manager
. In the device properties settings window, you must set the sampling frequency to 4000 Hz (Fig. 8). In the window for setting the properties of the measuring channel, set differential switching (Fig. 9).
Figure 8 - Configuring ADC and DAC in ZETLAB Device Manager
Figure 9 — Setting up measuring channels in the ZETLAB device manager
Viewing data in graphical form is possible using an oscilloscope program launched from the ZETLAB
Display → Multi-channel oscilloscope (Fig. 10).
Figure 10 — “Multichannel oscilloscope” program window
The basic settings for the oscilloscope program are as follows (see Fig. 10): interval - 200 s, frequency - 4.0 Hz. The Start/Stop button starts or stops reading and displaying data from the sensor. Using the Record button, the data displayed in the form of graphs is saved in an external file in text form.
4. Obtaining the dynamic characteristics of the temperature sensor
The dynamic characteristics of sensors 23.3828 and 27.3828 are constructed with an abrupt change in their temperature from room temperature to +100 °C. This is achieved by sharply lowering them into boiling water. It can be considered that this type of impact corresponds to a stepwise impact. The connection of the sensor to the measuring system is shown in the figures below.
1 - laptop; 2 — ADC module ZET 210; 3 - transistor current source; 4 - sensor; 5 — power supply; 6 - USB cable Figure 11 - Connecting the sensor to the measuring system: general view
2 — ADC module ZET 210; 3 - transistor current source; 7 — wires from the transistor current source to the ZET 210 ADC module; 8 — wires from the sensor to the transistor current source; 9 — wires to the power supply Figure 12 — Connecting the sensor to the measuring system: connection of the ZET 210 ADC module and transistor current source
4.1. Procedure for conducting the experiment
1. Turn on the laptop and wait for the operating system to load. 2. Connect wires (see Fig. 11 and 12) to the ZET 210 ADC module, transistor current source, sensor and power supply. 3. Connect the ZET 210 ADC module to the laptop using a USB cable. Make sure the Power LED is green. 4. Configure the ZET 210 ADC module (see paragraph 3, Fig. 8 and 9). 5. Turn on the power supply. 6. Measure and record the initial temperature of the sensor, which is equal to the ambient temperature. 7. Bring water in a special container to boiling temperature. 8. Launch the “Multi-channel oscilloscope” program on the laptop. 9. Place the sensor in a container of boiling water and keep it there until the transition process is completed (about 1 minute). Attention! To avoid burns, these operations must be carried out with caution and wearing cloth gloves. 10. At the end of the transient process, press the Stop button in the “Multichannel Oscilloscope” program. Then click the Record button and save the resulting graph of the transition process to disk. 11. Turn off the power supply and disassemble the measuring system.
4.2. Processing the experiment results
The purpose of processing the results obtained as a result of the experiment is to determine the transfer function of a given sensor. Since the temperature sensor is characterized by some inertia, it is convenient to use the transfer function of the aperiodic link to describe it: W(p)=k/(Tp+1)
It is convenient to process the results in the MathCAD package (Fig. 13). The main processing steps are as follows:
- reading data from a file using the READPRN function and plotting a graph;
- isolating the section with the transition process from the full schedule;
- calculation of the transfer coefficient k and the sensor time constant T.
Figure 13 — Listing of the program in MathCAD for processing the experimental results
For more “fine” tuning of the transfer function parameters, it is necessary to simulate the experiment in MATLAB Simulink (Fig. 14 and 15). By selecting the parameters of the transfer function, it is necessary to achieve good agreement between the calculation and experiment.
Figure 14 — Simulation of the experiment in MATLAB Simulink: scheme for calculation
Figure 15 — Simulation of the experiment in MATLAB Simulink: voltage graph on the sensor
How do you know if the sensor is faulty?
Signs of a malfunctioning coolant temperature sensor are as follows:
- The coolant temperature gauge does not work or does not show the actual coolant temperature.
- The coolant temperature “floats”.
- Continuously running cooling system fan (if injection engine).
- The “Check Engine” indicator light is on (if the engine is fuel-injected).
- The car overheats, “boils” (steam from under the hood, strong gurgling in the expansion tank), but the fan does not turn on.
We recommend: What causes white smoke to appear in the muffler
The cause of these events may be not only its failure, but also other faults (wiring, connections, etc.). Therefore, you first need to carry out diagnostics on the injector. If it is impossible to diagnose, or you have a carburetor engine, then immediately proceed to checking the coolant temperature sensor
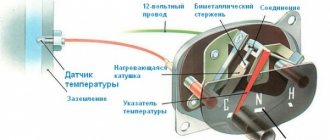
Engine temperature indicator: features
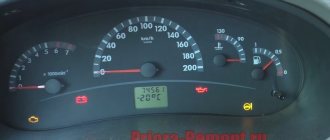
Let's start with a common situation. Let’s say that a car has a standard dial temperature indicator, but on such devices the scale may often not have calibrations, and the engine operating temperature needle in the middle position displays the real picture only conditionally.
At the same time, during operation, the driver notices that if the middle on the scale is the norm, then in various situations the needle can rise noticeably higher (for example, in traffic jams). It would seem that the motor is overheating.
Naturally, the movement of the car immediately stops, the owner hurries to turn off the engine and open the hood. However, upon inspection of the unit there is no. Then it is restarted and it turns out that it does not even turn on, although the device is operational.
When you feel the upper radiator pipe has an acceptable temperature, antifreeze does not “press” anywhere, the lower pipe may be completely cold, etc. Further checking of the coolant level and the condition of the coolant itself also shows that the fluid is normal, the interior heater (stove) is working normally, there are no air pockets in the system, and it is also working properly.
It also happens that if you let the engine cool completely, then start the engine and warm up the power unit to operating temperatures, this process can take a long time (judging by the indicator on the instrument panel). In this case, you can notice that although the needle has only risen a little, the radiator fan is already working, the lower radiator hose is warm, etc.
If we consider that everything is in order with the fan and cooling system, then the signs described above indicate a large error or problems with the engine temperature gauge. It is quite obvious that in such a situation it becomes difficult to understand when the engine reaches operating temperatures, whether the internal combustion engine is overheating, how long it is necessary to warm up the engine before driving, etc.
At the initial stage, many drivers begin to look for the cause. Some right away:
- the standard temperature sensors on the engine and in the dashboard are checked;
- wiring is ringing, etc.
We recommend: Mineral engine oil
In some cases, the problem can be solved, while in others, it is still not possible to achieve correct operation of the standard temperature indicator. The fact is that often the culprit is control electronic modules that give a certain failure.
Replacing such modules is expensive and impractical. In this situation, a quality solution is a digital engine temperature indicator. Such an electronic sensor has a very reasonable cost (on average, from 15 to 55 USD), and is relatively easy to connect and install. The range of measured temperatures is also very wide (on average, from -65 to +240).
Please note that installation features may differ slightly on different types of internal combustion engines.
- The device is usually powered from the ignition switch.
- The digital panel is installed in a convenient place inside the car.
- As for the sensor itself, for accurate readings it must be immersed in coolant.
In other words, the device must be screwed into the block or cut into the pipe. To do this, some drivers replace the standard temperature sensor by simply screwing in a new one instead. However, this cannot be done on cars with for a number of reasons.
The fact is that the controller receives readings about the coolant temperature. In this case, it is necessary to separately install the digital indicator sensor, since it is strongly not recommended to remove the standard temperature sensor from the system.
Connection to alarm
Typically, the manual for a car alarm provides instructions on connecting all sensors, including temperature ones. For example, in TOMAHAWK and STARLINE systems, one wire is connected to the orange-gray wire of the control unit. In ALLIGATOR - to black and green. The other end is always attached to the mass. In practice, this is equivalent to connecting in parallel to the hood sensor, which is what is most often done in practice.
Advice: laying the wires in the engine compartment must be done so that they do not dangle, but are securely fixed to the surrounding parts using electrical tape or installation clips.
The correct operation of the alarm with auto-start depends on the correct location of the additional temperature sensor. A thermistor made by yourself will cost several times less than a purchased product, and the creator will feel proud of the results of his work.